Example Analysis with Diginsight
Troubleshooting with diginsight is easy and, for any application, it happens in similar ways.
STEP 01: reproduce the problem and analyze the detail flow
The following image shows a diginsight application flow on a text based stream for PlantsController.GetPlantsAsync method. The flow can be easily obtained from developer machine log file, or from application live console such as Azure app streaming log or a Kubernetes console log: 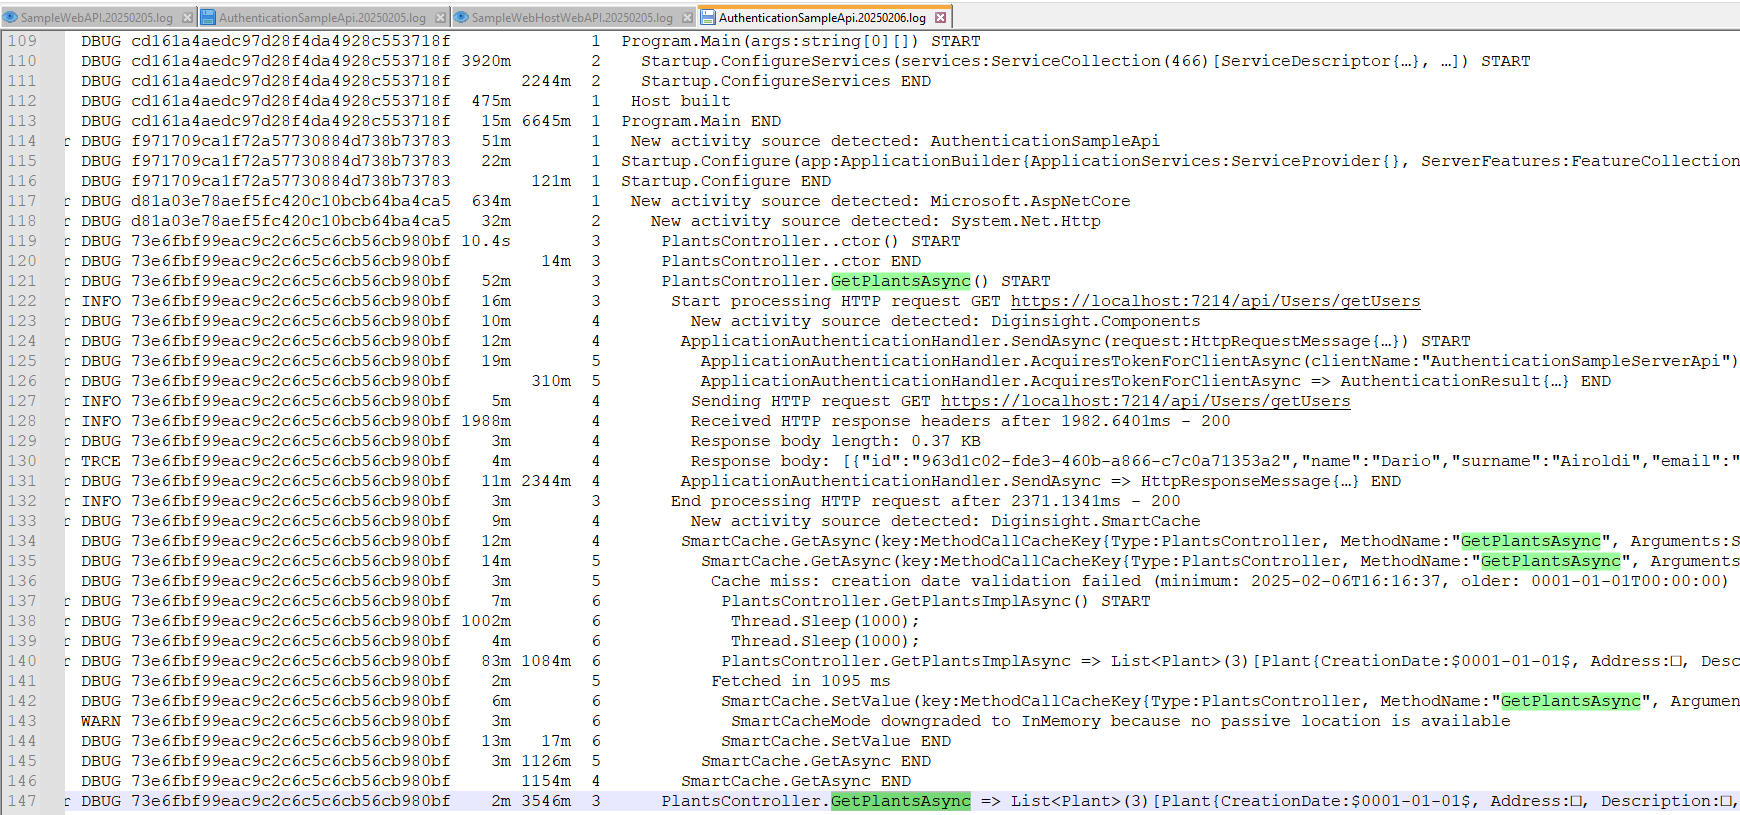
Starting from its traceid (0f83d3a1e2e834f4b8dab3f3f0f5bc12), the same flow can be found as an Azure Monitor Application transaction: 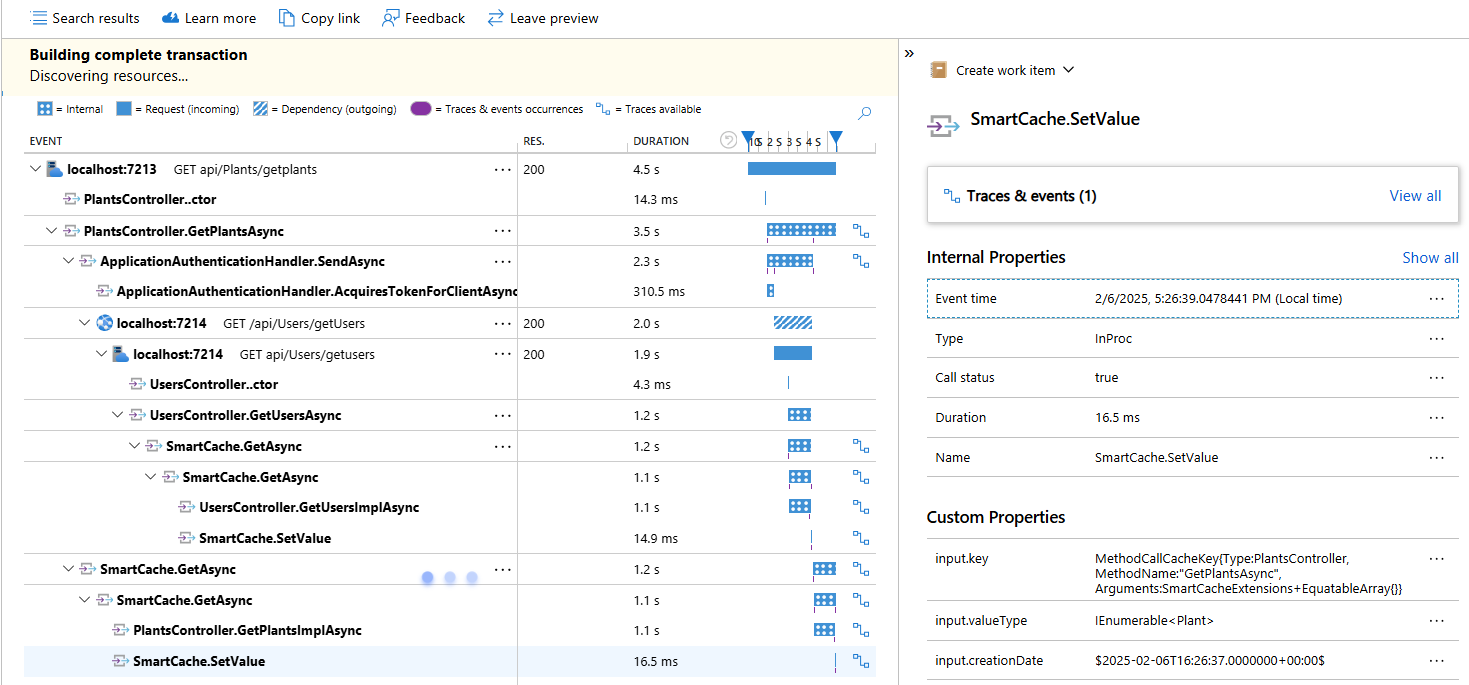
From the image we can observe that internal component calls are shown into the transaction flow and not just interactions across different components.
Also, note that the transaction flow structure is consistent with the transaction flow rendered on the live console log, where more detail is available. Also, note that the transaction flow structure is consistent with the application code as class names, method names, and variable names are obtained automatically.
Latencies for the same function can be analyzed in a chart with the span_duration metric, filtered on DataAnalyticsReportsController.GetDevices method. 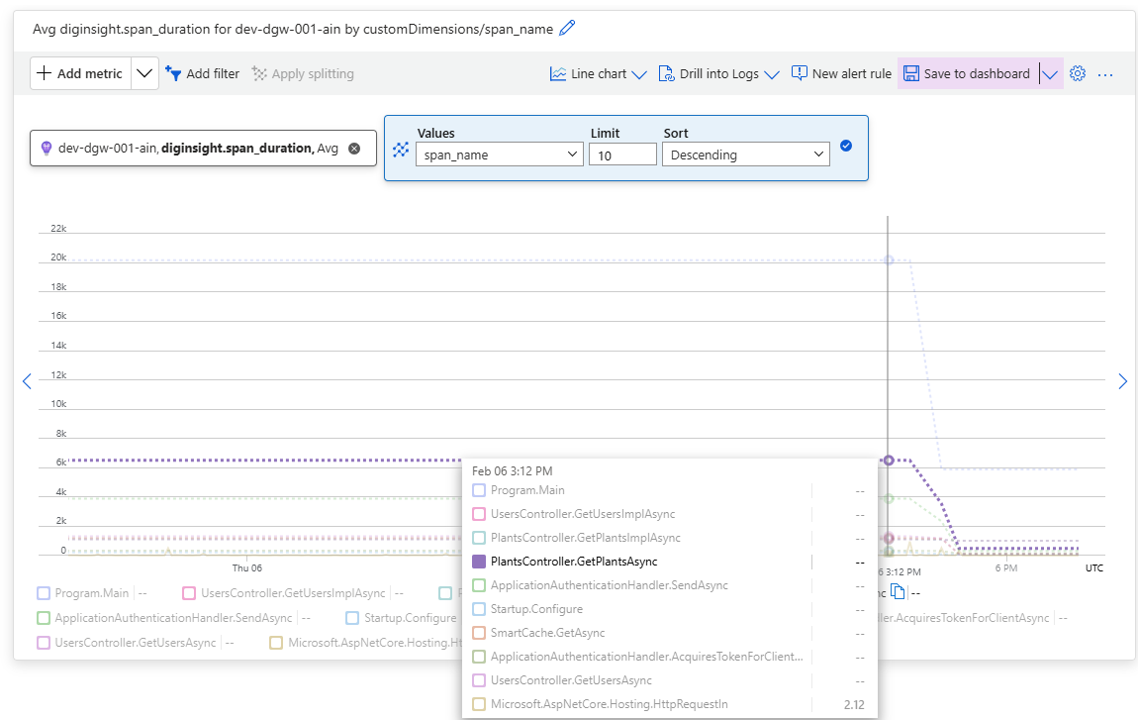
In facts, the span_duration metric allows analyzing latencies of any method within code.
Also, we’ll see that the developer can easily add other metrics and metric tags to split and compare values in different conditions (eg. by site properties, user properties etc)..
Build and Test
Clone the repository, open and build solution Common.Diagnostics.sln. run EasySample and open the log file in your *** folder.
Contribute
Contribute to the repository with your pull requests.
License
See the LICENSE file for license rights and limitations (MIT).